


When tracing the fluctuations of NATO spending in the last two decades, a couple of interesting trends can be observed. The first trend is not exceeding the recommended in 1999 2% of GDP spending. Interestingly, this concerns only the average spending of European members and Canada, without the USA – a traditional steam engine of NATO development. One of the factors for lower spendings could be the acceptance of new members into NATO. Poland, Hungary and Czech Republic economies faced economic problems at the time. This trend is also visible in the newest report. For 2011-2018 spending on defense, Poland is in the lead with 1,72% to 2,22% GDP being spent on defense. Czech Republic spent between 0,96% and 1,11% GDP in the same period while Hungary`s expenses totalled up to 0,86% – 1,05% GDP. NATO expansion, however, should not be looked upon as the only factor affecting the European spending on defense. The downturn was visible through the whole of 90`s with a noticeable change after the September 11th, 2001 attacks. Destruction of World Trade Center resulted in increased expenditures mostly in the USA but affected the statistic of the whole NATO. Europe`s defense outgoings were on the downturn until 2007.

The biggest challenge facing the NATO Secretary General, Jens Stoltenberg, is maintaining good transatlantic relations within the Alliance
The ISAF mission
The biggest factor affecting the defense outgoings in the last decade was the Afghanistan conflict. Operations in Central Asia were affected by the International Security Assistance Force (ISAF) created as a part of the NATO structure. Between 2001 and 20014 there were 130.000 from 51 countries taking part in this operations. Years 2007 – 2009 are especially worth a careful look. At this time an unprecedented increase in spending was noted. In those 2 years, alone USA enlarged their armed force’s budget from 4% to 5,29% of GDP. This approached the cold war era spendings. As Americans are the biggest contributor to NATO, this seriously affected the overall figures. Globally, NATO increased their outgoings to 3,28% GDP – the highest number since the 1990`s. The graph illustrating the expenditures of Canada and European members is also very interesting. Despite failing to reach the recommended goal of 2% GDP, first time for 20 years there was a small increase in overall GDP percentage of the NATO defense budget. This, of course, is a direct result of Afghanistan happenings. ISAF started their control-gaining activities in the south-east part of the country in 2006. The joined operations were opposed by local guerrilla groups supported by the Taliban. The resulted in hard fightings which tied up the coalition forces between 2007 and 2008 and increased the operation`s cost. Additional 40.000 soldiers were sent to Afghanistan in 2009 and the NATO budget was affected again.

NATO, USA and other member’s expenditures on defense summed up as a GDP percentage. The green line indicated the recommended 2% GDP threshold
Global crisis
Another factor is the 2007 global financial crisis which started in the USA and impacted most of the important world economies. This resulted in a throttled development and GPD destined for the defense was lowered. The economy was one of the factors affecting the intensity of NATO involvement in Afghanistan. Presented data clearly shows the drop in GDP percentage for both USA and other members. In 2015 it reached 3,56% in the United States and 1,40% average in Europe and Canada. This brings up another turning point for NATO. This time, however, Europe and the Middle East became the focus of attention.

Comparison of NATO expenditures between the USA and other member countries (totaled up) in the years 2011-2018
Russia and the Middle East
2014 Wales summit
NATO planners had to consider two critical threats to organization`s strategies: the Russian – Ukraine conflict in Donbas and the issue of providing for hundreds of thousands of migrants and refugees arriving from the Middle East. Global security policies were illustrated by 2014 Newport NATO summit when a Readiness Action Plan was accepted with a goal of increasing the defense capabilities of NATO`s territories. As an aftermath of the Newport summit, most of the European countries increased their spendings. According to the NATO HQ analysis, the only countries reaching the 2% threshold in 2018 were the USA (3,5%), Greece (2,27%), Estonia (2,14%), Great Britain (2,1%) and Latvia (2,0%). Poland (1,98%), Romania (1,93%) and France (1,81%) are nearing the recommended value.

The US as the most important force in NATO will continue to exert the greatest influence on the formation of the Alliance’s doctrine
Redefinition of challenges
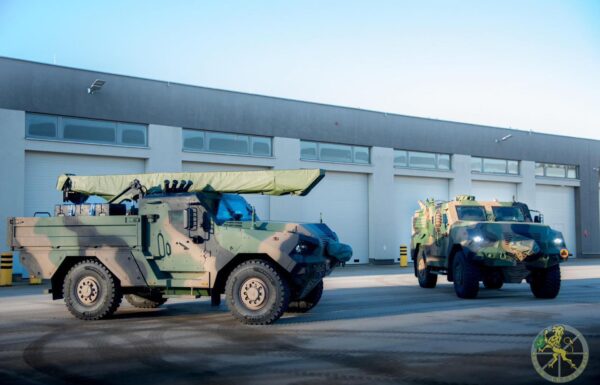
Redefinition of the biggest NATO challenges resulted in modernizing processes started by European armies. The twenty-first-century doctrine of light expedition forces gave in when confronted with changing realities. Afghanistan already showed that the need for artillery/heavy vehicle support has to be considered. The need for armor when combating Iraq`s and Syria`s insurgents was obvious. At the same time, the armored forces had to modernize and adapted to the changing combat field conditions. The threats of Russian-Ukrainian conflict escalation left a visible mark in the decision-making. All those factors caused a jump in expenditures on new equipment and modernization. Compared to 2014 the increase happened in each country but the UK and France. The 20% of the overall defense budget was to be spent on modernization according to the NATO planners. This value was reached by 15 out of 28 member states (including Poland with 23,95%) US domination When analyzing the defense budgets of NATO members in this period USA`s dominant position can`t be overlooked. Over 70% if the NATO financial efforts come from the United States. It is expected that in 2018 alone USA will provide 706 billion USD compared to 286 billion from European countries. Poland`s budget is estimated at just over 12 billion USD (42 billion PLN). A very pronounced disparity is visible between the North Americans (including Canada) and the Old Continent. Since the beginnings of NATO, USA was the main – if not dominant – member. Initially as a guarantor of West`s safety, then as an anti-terror coalition leader. But when analyzing recent communications from USA administration it looks like the USA is considering the redefinition of their role as a leader.

Defense expenditures of NATO countries shown as a percentage of global GDP. The green line indicates the 2% recommended threshold. Comparison of 2014 data with predicted 2018 outgoings.
US versus China
It seems that Donald Trump aims for a general change of armed forces subordinate to him. Despite the tensions with the Russian Federation, America seems to be more troubled by the increasing position of China. The People Republic of China is currently the second most powerful (after USA) economy in the world. China also consistently builds their military potential. The most worrying for the intelligence analyst might be the yearly increase of expedition potential of Chinese armed forces. Modern navy vessels, such as aircraft carriers and submarines and expansion of South Sea bases might force Donald Trump to use the US Navy for maintaining the USA`s and their Asian allies position. Such action will necessitate a significant spendings and might affect the USA`s presence in Europe.

Spendings for modernization and new equipment as a percent of the overall defense budget. 2014 and 2018 budgets comparison with 20% indicated by the green line.
Europe’s involvement
NATO has to consider the need for Europe` s bigger involvement in providing the defense potential. After the Newport and 2016 Warsaw summit, it can be concluded that the aggressive Russian politics concerns the European leaders. Founding of the NATO Response Force looks like an effort to take over some of the responsibilities of Old Continent`s defense. Decisions made in Wales were an ad-hoc attempt to respond to the Russian invasion of Ukrainian territory. The following Warsaw summit was to be a next stage in the development of new NATO doctrine. Four battalion groups were created and rotated through Poland and other Baltic states. USA`s armor brigade and infantry elements were placed on the NATO`s east flank. When analyzing the yearly change of defense- destined GDP one may conclude that in the 2014-2018 majority of NATO states increased their spendings. Further analysis shows a more pessimistic image. In 2011-2018 only Greece, Great Britain and the USA reached the recommended 2% level. Other European countries reached the following levels: 2011 1,55%, 2012 1,52%, 2013 1,49%, 2014 1,44%, 2015 1,42%, 2016 1,44%, 2017 1,46%. This value in 2018 is set to reach 1,50% GDP (data uses prices from 2010). This leads to a sad conclusion: Europe will be dependant on the USA for a long time. This, in connection with tensions between the USA and China, should prime the European leaders for renewal of trans – Atlantic relationships
 .
.
2011-2018 NATO states defense expenditures in millions of dollars

Changes in defense spendings of NATO countries as a yearly GDP percentage
Size of armies
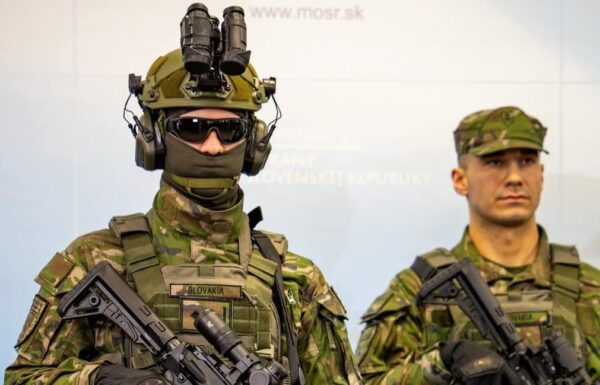
Data concerning the size of armed forces look a bit better. The USA is the biggest army, numbering 1,314 million soldiers. European soldiers add up to 2,004 million together with Canada. This means that NATO has 3,176 million armed forces personnel. Polish presence in these statistics looks interesting as in 2015 Polish armed forces numbered 99.000, in 2016 102.000 and in 2017 105.000. Estimated 2018 levels are to reach 118.000 soldiers. This data includes the dynamic development of Wojska Obrony Terytorialnej (Territorial Defence Forces).

NATO members size of armies
Procurement
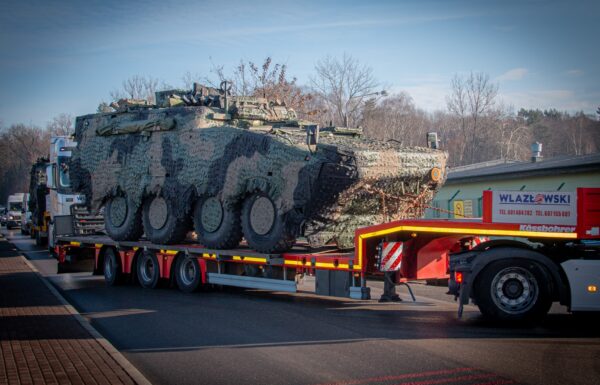
Numerous army, however, leads to difficulties in budget balancing. When money is needed for soldiers savings are usually made by cutting the spending on procurement and infrastructure maintenance. From this perspective, it looks like the Polish Army has this problem. Data from 2016 and 2017 show that accordingly 47,15% and 49,99% of the overall defense budget was spent on manpower. Equipment expenditure was at the 21,62% and 22,04% levels but the data for 2017 are approximate. Such budget balancing imprints on key modernization programs of the Polish Army. Until the middle of 2018, only the Leopard 2 to Leopard 2 PL programme was started and the agreement for the purchase of 2 Patriot missile batteries was signed. The rest of the biggest and most expensive programs, like procurement of multi-mission helicopters, purchase of assault helicopters (Kruk programme), procurement of short-range anti-aircraft weapons (Narew programme), purchase of new generation submarines (Orka) and replacing the BWP-1 infantry fighting vehicles are suspended.

Percent share of expenditure on modernization (part a) and manpower (part b) in member state`s budgets
New initiative
As a part of NATO expansion on the Old Continent a new readiness initiative will be started. NATO will have 30 mechanized battalions, 30 airforce squadrons, and 30 navy vessels. Units are to be ready for action in 30. The whole initiative gained a 4 by 30 nickname. During the Brussels summit, new commands were also established. Atlantic command will have its base in Norfolk, Virginia and logistic support command will be based in Ulm. Additional Cyber Operations Center will be formed in Supreme Headquarters Allied Powers Europe (SHAPE) HQ in Mons.

NATO HQ based their presentation on official data obtained from members. The data includes spending on each branch of armed forces, foreign missions and administration. Military pensions paid by the ministries of defense are also encapsulated. Some of the figures use prices from 2010.
This article was originally published on MILMAG 03-04/2018
